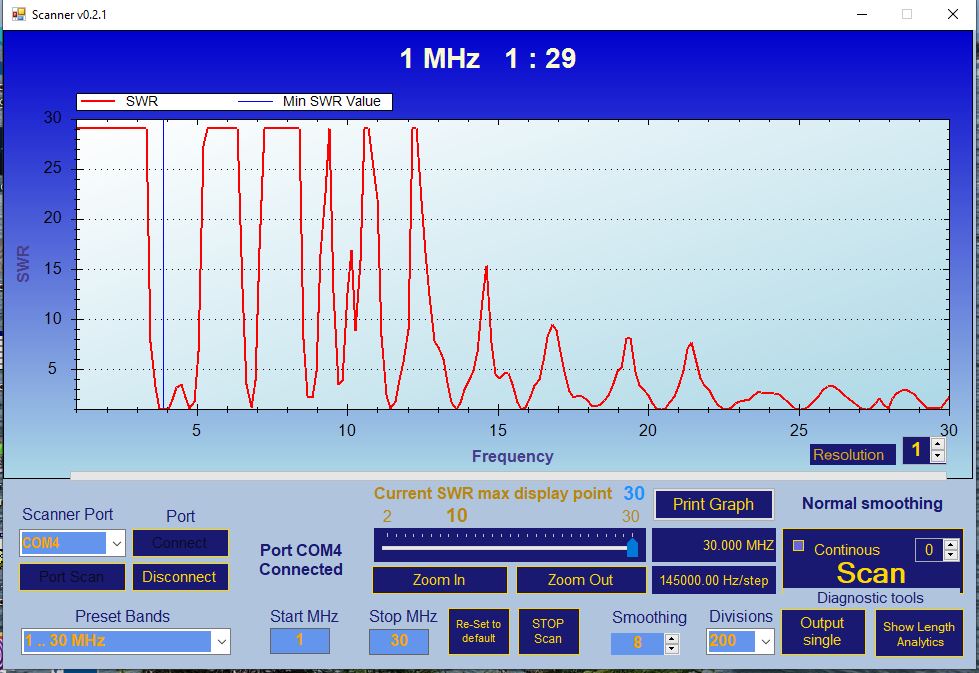
Antenna Analyzer Operation
Running a Scan of your antenna
Mount the analyzer shield on your Arduino R3 and insert the AD9850 into the socket on the shield. Attach your Arduino to a USB port on the PC. The red light will illuminate.
Attach an antenna to the antenna connector on the Shield.
The analyzer program will accurately report the forward and reverse signals generated by the signal injected into the antenna and feed lines to determine SWR values. The most accurate readings are generated when feed lines are at a minimum. While the system is tolerant of long feed lines, antenna switching systems, and other devices in the feed path, they may introduce reflections and pseudo resonances within the system that are not caused by the actual antenna being measured. The best approach is to choose a measurement point that eliminates these areas of problem. The graphic below was generated by testing my tri-band beam with approximately 125ft of feed line and an Ameritron RCS-4 antenna switch. Notice the feed line reflections below 14 MHz, due to long feed lines.
Select the Scan port from the combo box. If the Arduino does not show on a port, Press Port Scan to re scan.
When the correct port is selected, Press Connect.
When upload to the UNO is complete, a connection message will display Port # connected.
With the antenna connected to the Shield, start the scan. To start the test Press Scan
The graph will display the results of this test.
Open Feed Lines
Wire Antennas


Not Connected to Feed Line
A blank scan indicates that the analyzer is not connected to a feed line. Check your connection.
Trap Vertical Antennas
This is a partially tuned trap vertical. It is adjusted by lengthening or shortening the distance between each trap.
In this example, the 10-meter adjustment is within tolerance as well as the 15-meter adjustment. The next trap is for 17 meters and the scan indicates that the distance between the 15-meter segment and the 17-meter segment should be increased.
Once that has been done, and a scan shows that the resonance point has moved downward, we will adjust the next segment until the entire antenna spacing is correct and each segment is at a point of resonance.
Multi-band wire antenna's resonate points depend on multiples of the lowest frequency for which the antenna is cut. Most require an antenna tuner for final adjustment. Generally, if the antenna length for its base frequency is adjusted correctly the other multiples become close to naturally resonating with little external tuning required.
This is a scan of a balun end-fed multi-band antenna from Maple Leaf Studio Antenna Company. With a tuner, it will resonate nicely, but the scan shows that it is a little short in its raw form as the 80-meter base resonate point is at about 4 MHz.

Technical Theory of Operation
Extending this wire would help all multiple bands get closer to their ideal resonate point.
Commands
Make sure to check your connections as these may also be the cause.
Correctly Tuned Antennas
When reading the results of an analysis of your antenna these are some of the visual displays that might be seen. The first is a well tuned antenna system.
This is a Force 12 tri-band beam for 20, 15, and 10 meters. The blue line indicates the lowest SWR point for this scan, however, due to several factors this line might be shown at another node point.
When Show Length Analysis is pressed the length calculator box is shown. The box will display the calculated antenna length for any target frequency entered. The calculated length for a target frequency is based on the speed of light in a vacuum and is the ideal length for the target frequency.
Select the appropriate antenna type and move your cursor over the red line display of the current frequency on the graph. Based on frequency the measured length is displayed. A length modification to match the target frequency is then presented. A positive value means that the measured antenna should be lengthened. If the value is negative the antenna should be shortened.
Make sure to choose the correct antenna type.
Signal generator function.
Using the diagnostic single-frequency output, the analyzer will function as a signal generator.
The PC card mounts an AD9850 signal generator module, which is a very accurate, digitally controlled signal generator of low power. It generates a spectrally pure, frequency programmable, analog output sine wave.
It is a handy source of RF signals for testing. Connecting a loop to the output can be used as a quick signal generator. While it does not replace a commercial lab signal generator it is a handy source of signal, and programmable from our analyzer.exe software for any frequency between 1MHz and 55MHz. So, you can easily maximize your investment as it is a multipurpose instrument.
Choose to update UNO code. Only required if new update code is installed. Then press Connect.
In the view above the resident nodes are those with the lowest SWR. In this case, the tri-band beam shows nodes correctly at 14, 21, and 28 MHz reflections from the feed line and line switches at 2 SWR and above are ignored.
Hovering over any graph reading point wll show a popup containing information about that point, including effective radiated power and actual radiated power in Watts. Setting the transmit power on the calibrate panel for your transmitter will provide accurate information regarding the effect of mismatch impedance. Setting for graph below is 1000 watts.
The next scan shows a 50-ohm feed line without a connection to your antenna.
The multiple dips are due to the reflected nature of the cable bouncing back from the end. It of course does not resonate, and only generates regular reflected signals as the signal bounces.
If you see this happening when attached to an antenna it may be due to a faulty connector, a bad or not closed relay in a remote system, or humidity within the cable system.
Interpretation of Scans
Other applications
The analyzer.exe interface will function as a dip resonance meter and some interesting and productive uses may be developed using a loop of wire or capacitor probe connected to the antenna connector.
I was able to measure the choke point of choke and capacitor systems on my Cushcraft R7 vertical antenna that isolates multiple resonance points in the multi-band unit, by placing the loop around the unattached choke and scanning the appropriate frequency range. I was able to visually discover the resonating point and the high and low cutoff points
Antenna Length Analyzer
Help adjusting antenna lengths for correct resonances
Start the analyzer.exe PC program
.
The shield mounts an AD9850 signal generator module as a socketed plug-in. It combines a 3.5v peak-to-peak signal amplifier and amplifying detector hardware to detect and process both forward and reverse signals from a connected antenna.
Software driving the Arduino UNO provides control signals to the AD9850 which are instructions to the device to generate a signal of a specific frequency. While this signal is amplified and passed to the antenna both the forward and reverse components of the signal are detected by the detector diodes, amplified, and measured by the analog input circuit of the UNO R3. These detected components are then computed. The resulting SWR calculation is sent to the display program on your PC via the USB connection. The software then instructs the generator to output the next testing frequency and the process restarts until the entire frequency range being measured is completed.
Good Antenna Construction Practice
For any antenna system when impedance is correct, the length of radiating member determines the resonance point for a particular frequency. If the length is correct the impedance follows. Antenna tuners correct out of balance impedance at the expense of radiation power. This is a positive function for the driving device (transmitter) as it causes this device to have a reduced impedance at the feed point. Good antenna practice is to accurately adjust the length of the radiating member to a multiple of the wavelength that is transmitted and to check it with a good analyzer.
